
TURNING LIVED EXPERIENCE INTO ACTIONABLE INSIGHTS
Pulse of UX is a community research initiative exploring how the field of UX is changing—what people are experiencing, the challenges and opportunities they face, and where UX may be heading.
We bring together perspectives from people working in UX and from the roles around it, including product, engineering, operations, and leadership.
FROM COMMUNITY SIGNALS INTO ACTION

Listen. We gather perspectives through surveys, interviews, workshops, and community conversations.
Make sense of the data. We look for patterns, tensions, questions, and differences across people’s experiences.
Share with transparency. We publish findings and create space for the community to explore, question, and discuss them.
Move forward with intention. We use what we learn to identify what matters and support meaningful next steps for the field.
2024 IS WHEN IT ALL BEGAN…
…as an onsite experiment at uxcon vienna.
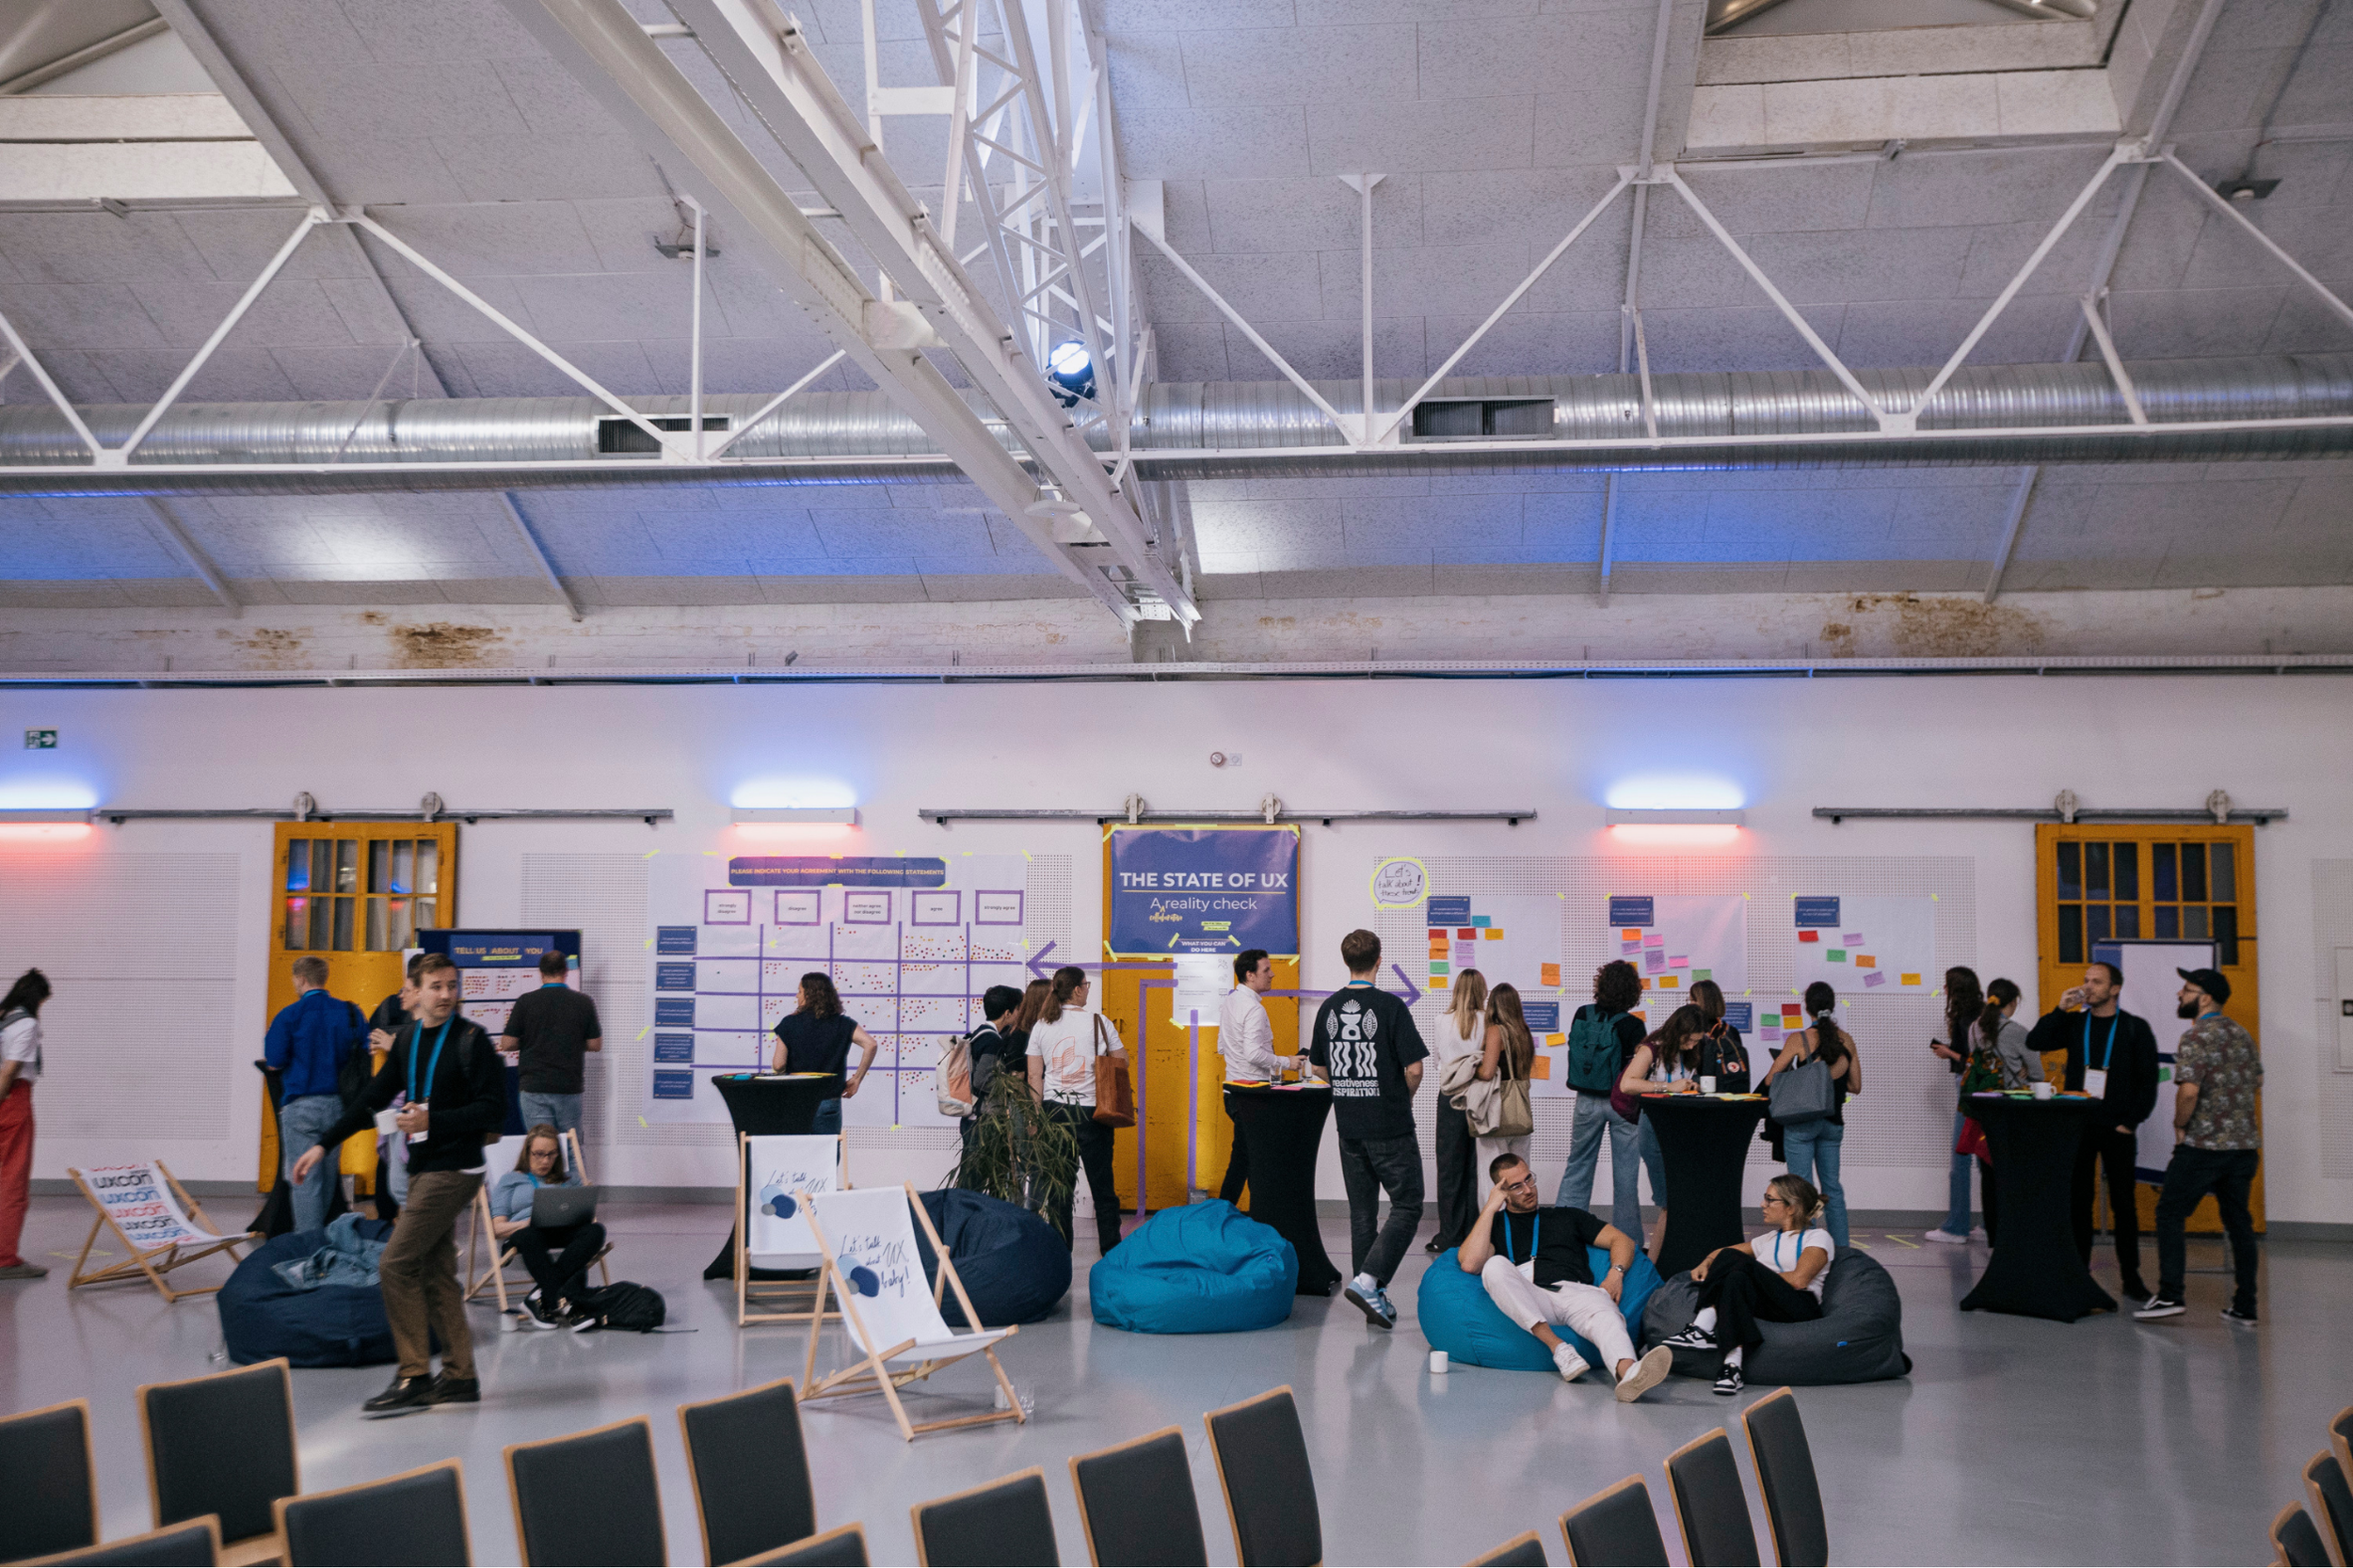
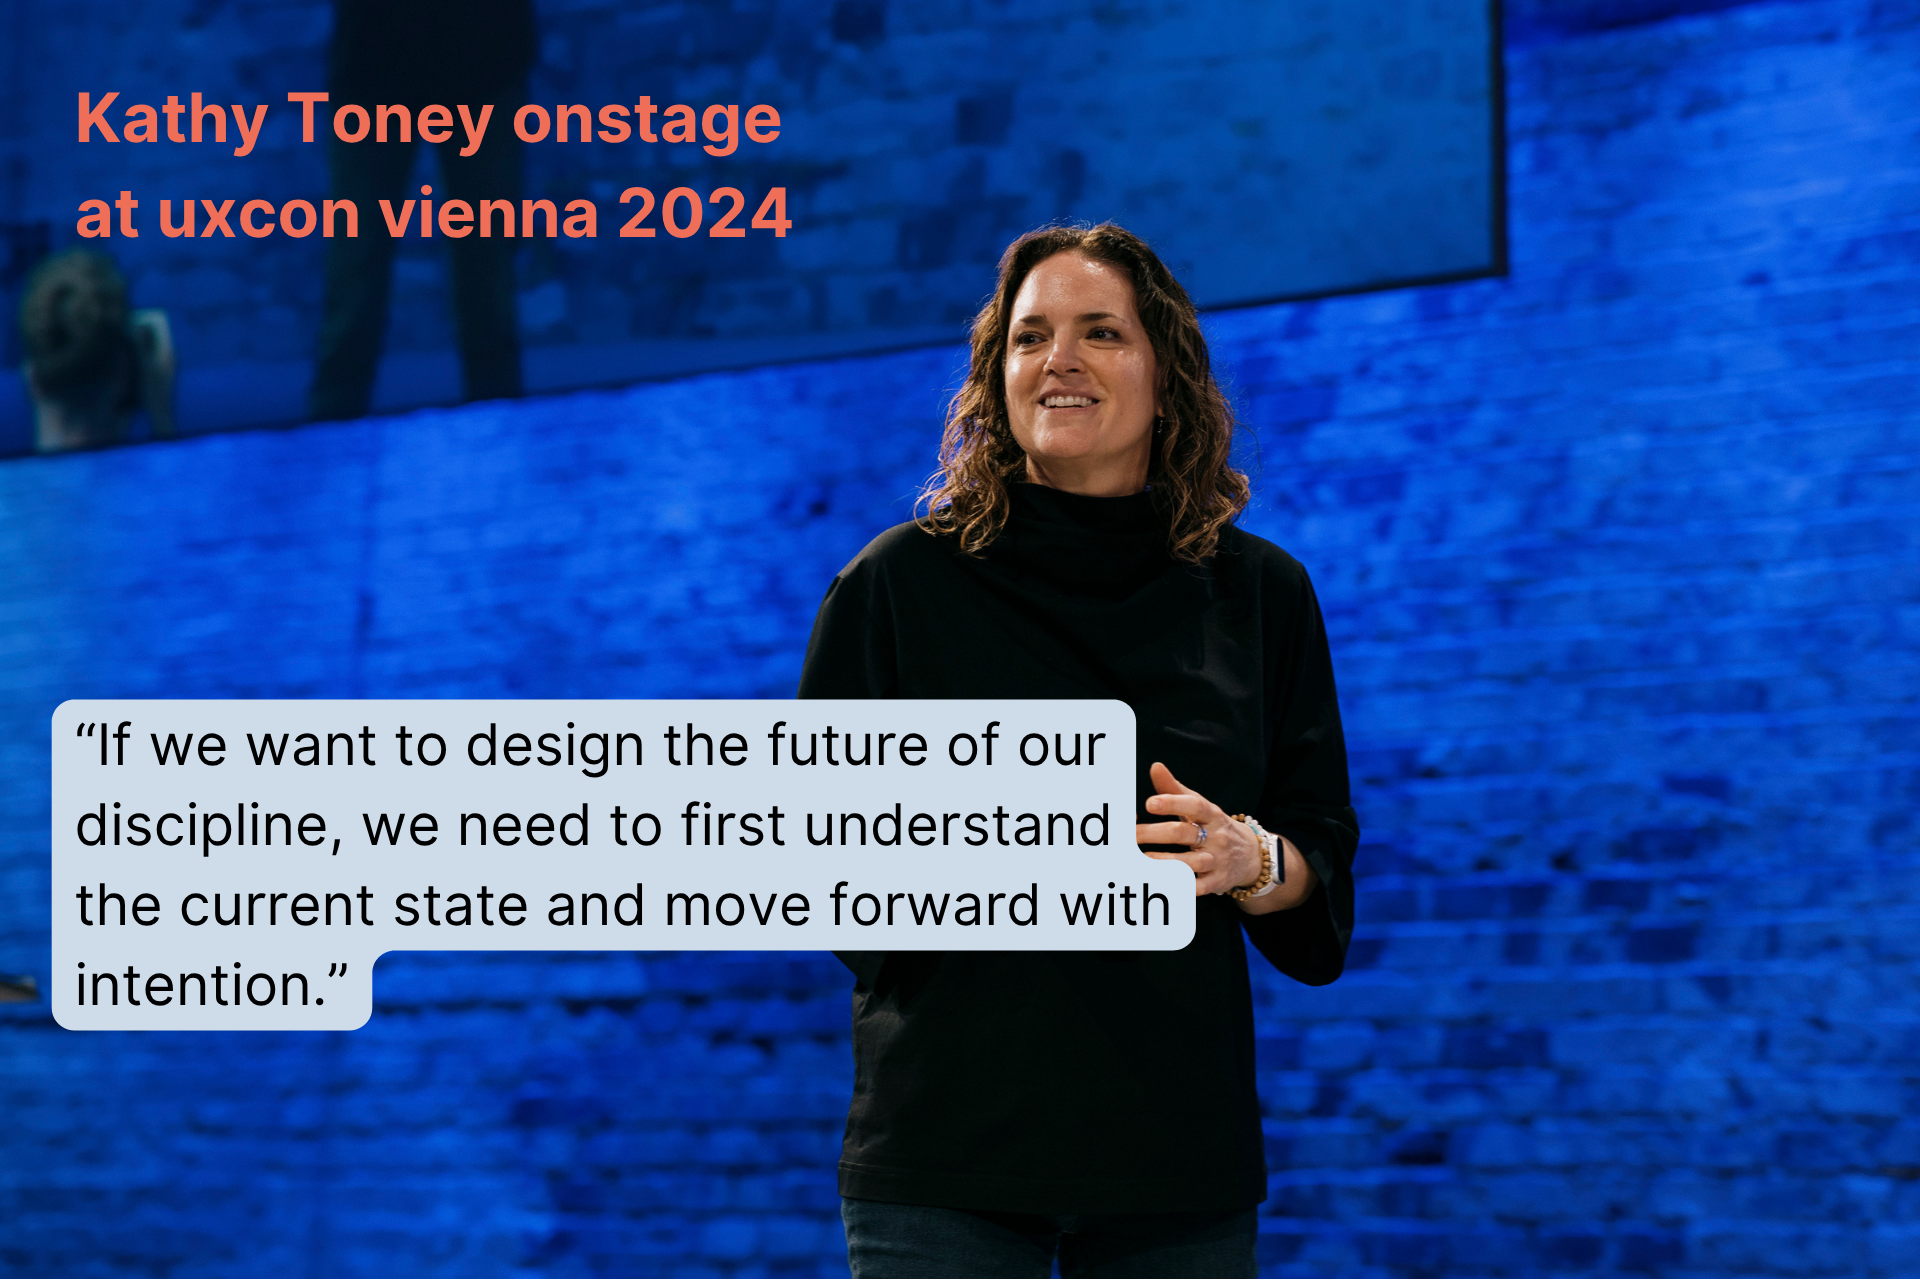
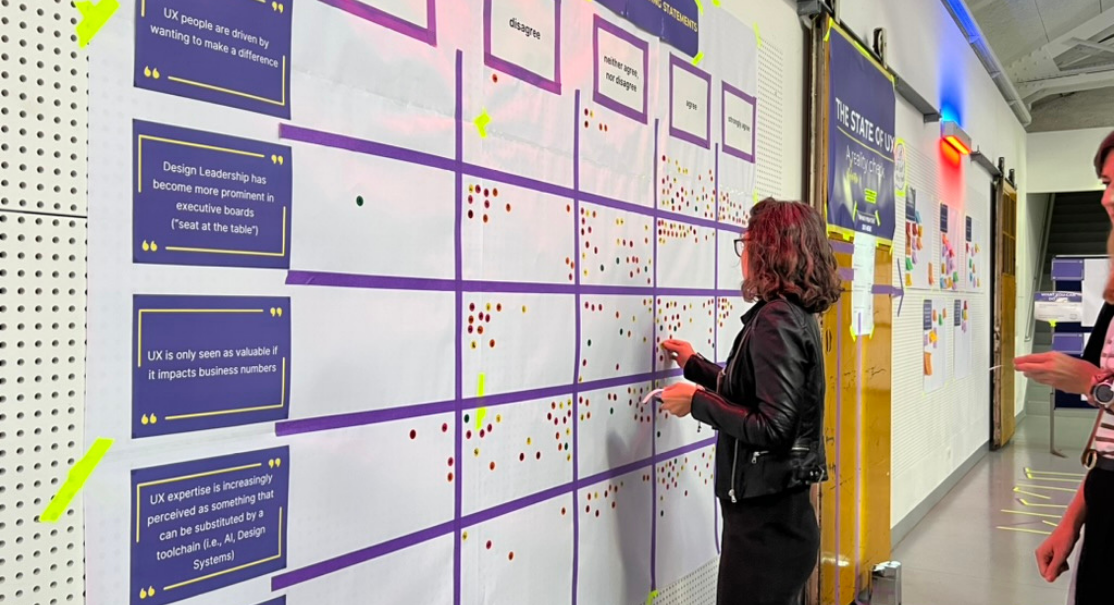
We wanted to:
find out what other UXers were observing and experiencing regarding the state of UX,
and
create an opportunity for discourse among attendees who didn't necessarily know each other
to
challenge our own hypotheses and biases.
Hypothesis #1
UX people are driven by wanting to make a difference.
Hypothesis #2
Design Leadership has become more prominent in executive boards (“seat at the table”).
Hypothesis #3
UX is only seen as valuable if it impacts business numbers.
Hypothesis #4
UX expertise is increasingly perceived as something that can be substituted by a toolchain (i.e., AI, Design Systems).
Hypothesis #5
UX in general is undervalued by non-UX disciplines.
WHAT WE LEARNED
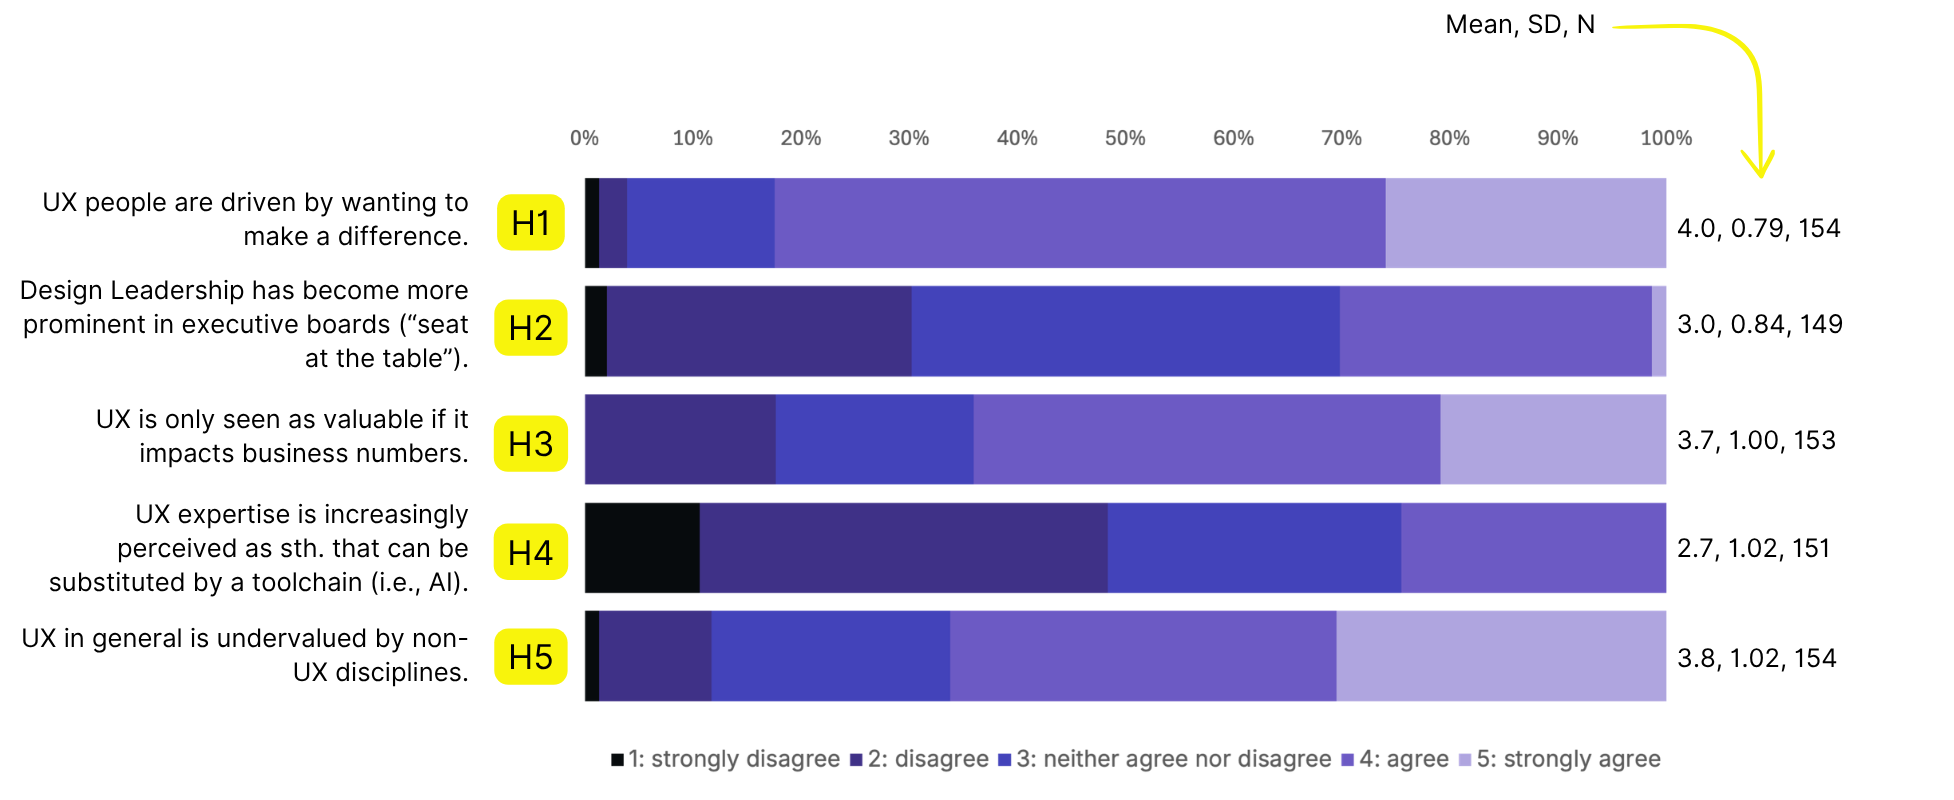
Rating of hypotheses
Line bars show % per agreement rating for each hypothesis
OUR VALUES
